Feb. 8, 2026
Summit County Real Estate Market Update: Momentum Builds as Opportunity Expands

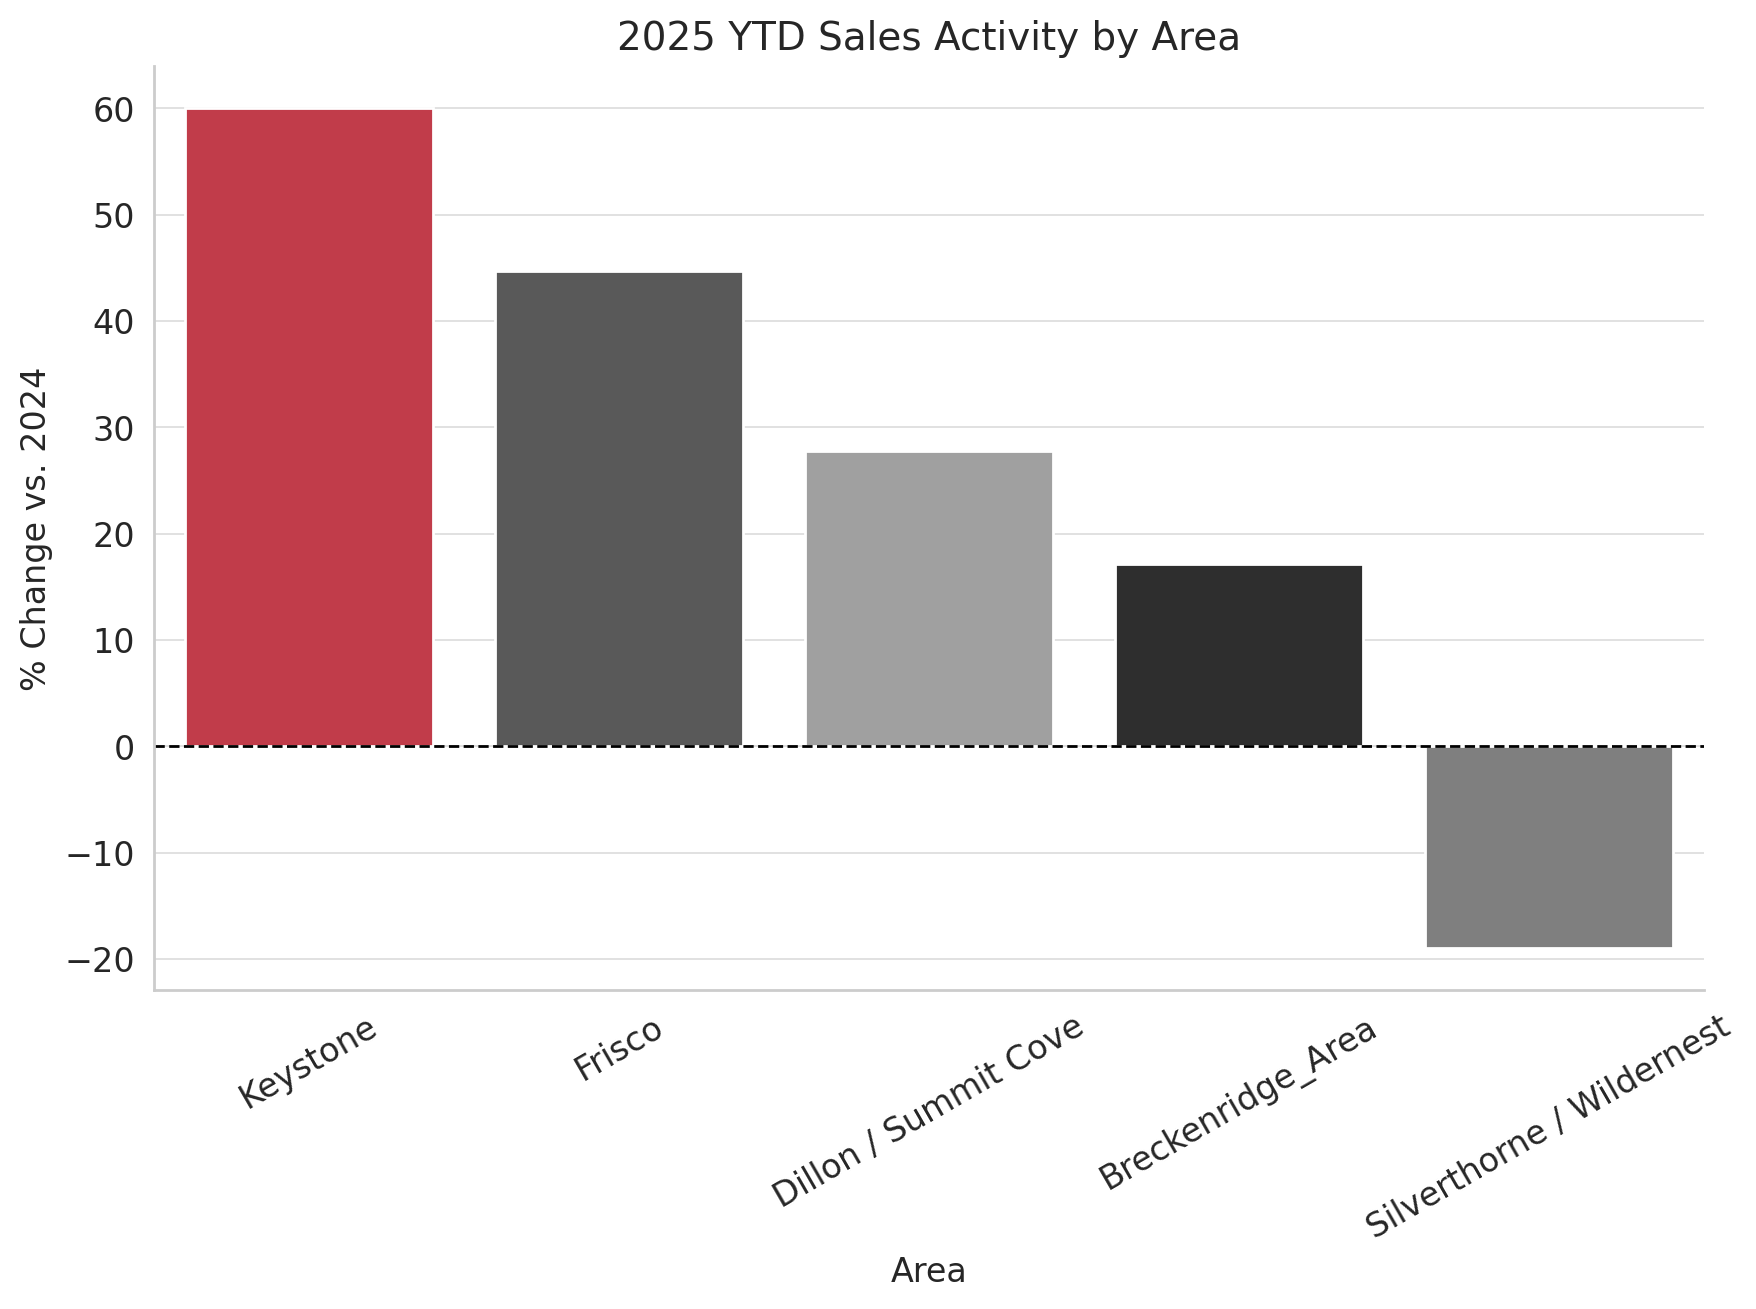
The first half of 2025 marked a clear transition in the Summit County real estate market. Rising inventory levels and more deliberate buyer behavior set the tone early in the year, creating a noticeably more balanced environment. As the market moved through summer and into the fall selling season, momentum strengthened—particularly following the recovery from the April equity market correction. Closed sales increased compared to the same period in 2024, signaling renewed confidence among qualified and well-capitalized buyers.
Sellers who adjusted quickly to these evolving conditions and priced strategically generally achieved outcomes consistent with prior-year values. At the same time, buyers benefited from expanded inventory and increased negotiating leverage—conditions that have been largely absent since the pre-COVID market cycle.
Key Takeaways from the 2025 Summit County Market
Several defining trends shaped the 2025 real estate landscape across Summit County:
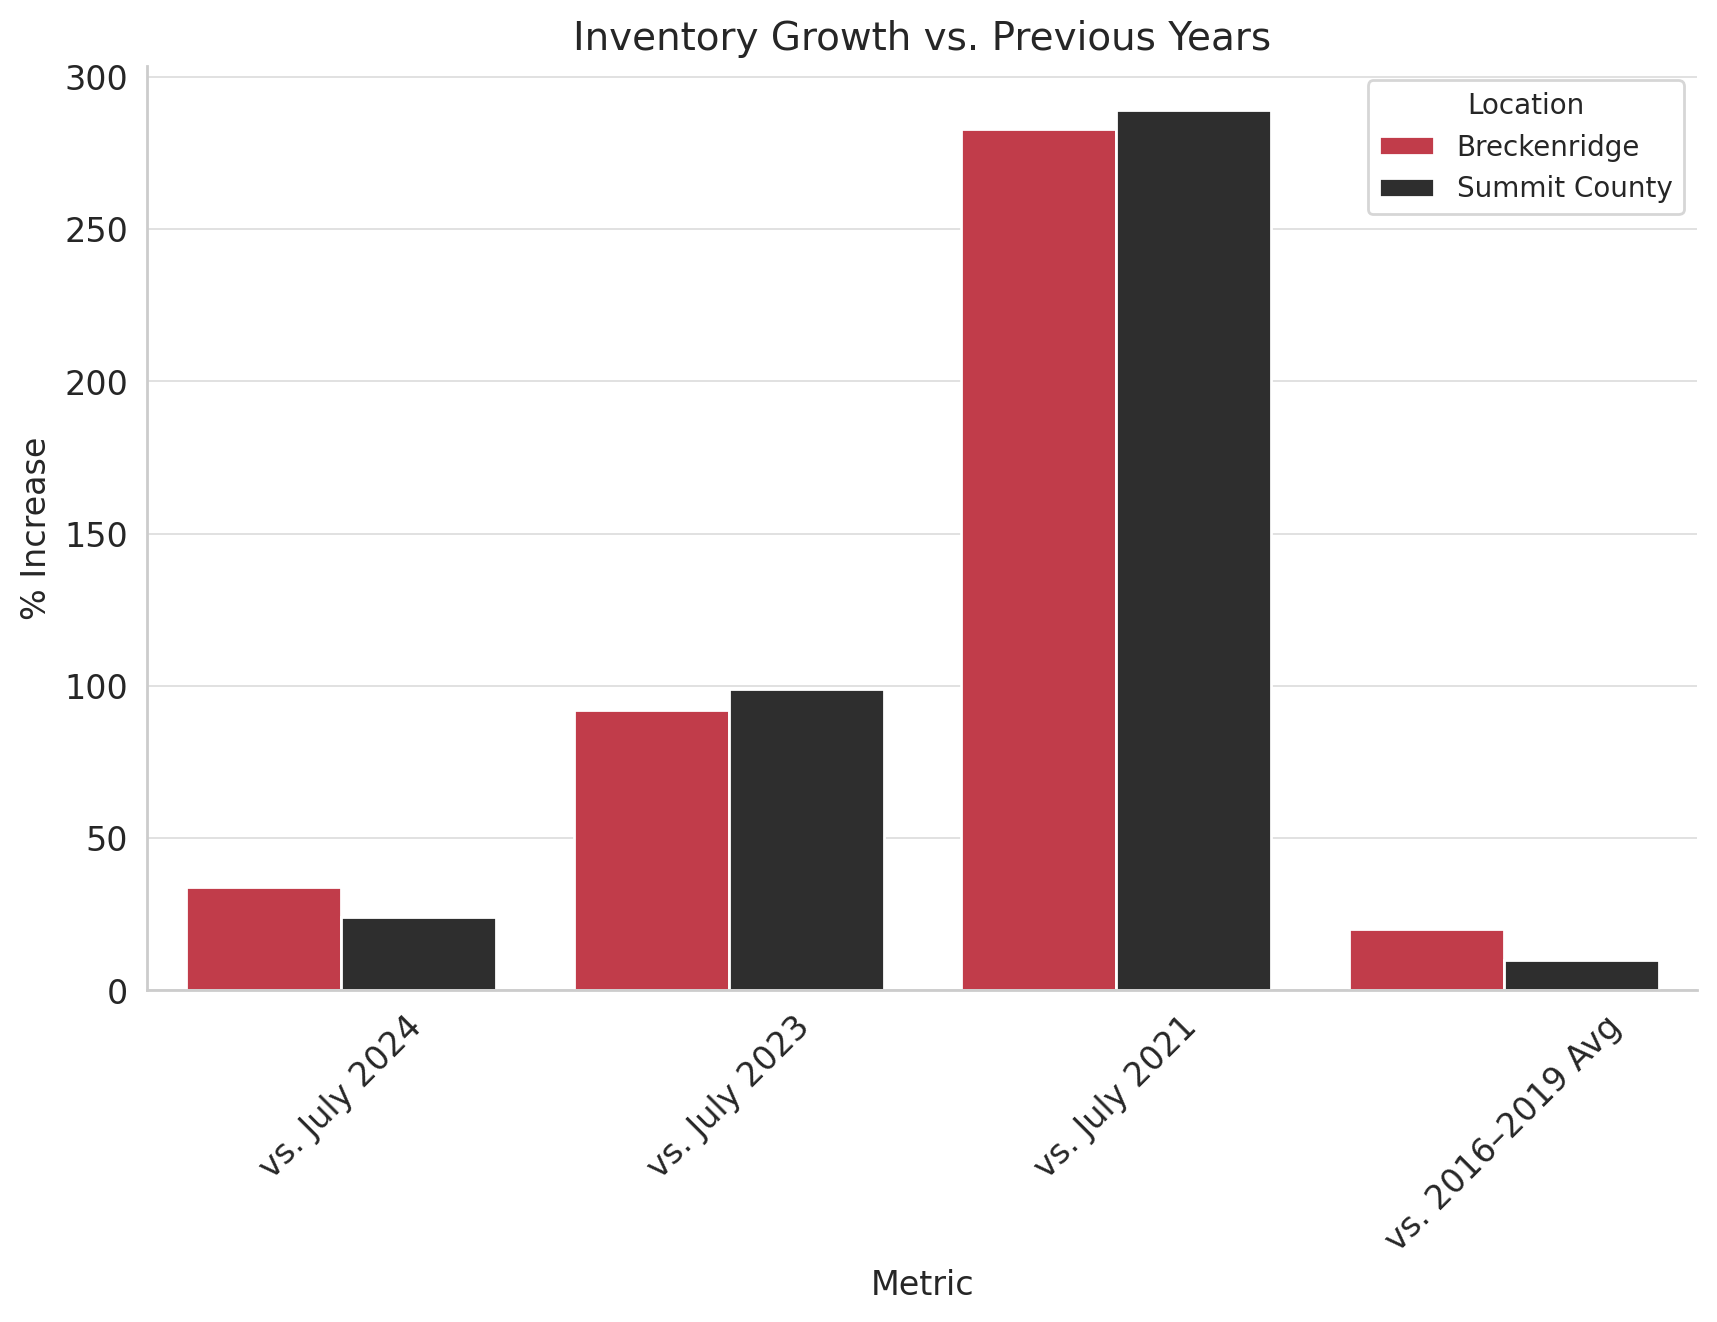
Inventory levels increased across most submarkets compared to 2024, providing buyers with more choice and flexibility. A late-year pickup in sales activity helped restore balance across many property types. Average Days on Market rose approximately 30% year-over-year, increasing from 60 days in 2024 to 78 days in 2025, giving buyers more time to evaluate opportunities and make informed decisions.
Townhome sales declined on an overall basis; however, newly delivered townhome projects in Breckenridge continue to sell at a strong pace. This suggests a statistical shift rather than a fundamental change in buyer demand, with location, design, and new construction continuing to command attention.
Winter Conditions and Short-Term Market Impact
Early winter has brought softer visitation patterns, largely influenced by below-average early season snow conditions. According to the Breckenridge Tourism Office, lodging nights are down approximately 8% year-over-year, while showing activity is estimated to be 10–20% lower than last ski season at this point.
While short-term traffic has moderated, these conditions continue to favor prepared buyers and well-positioned sellers. Reduced urgency often creates space for thoughtful decision-making, strategic negotiations, and cleaner transaction outcomes.
Why Positioning Matters More Than Ever
This is a market that rewards preparation and precision. With elevated inventory and discerning buyers, homes gaining the strongest traction share several common attributes: pricing that reflects current competition, exceptional presentation and professional staging, unique architectural or location-driven appeal, and pre-inspection transparency that builds buyer confidence.
Well-positioned properties are still achieving strong results. The difference is that preparation now plays a larger role than it did in the faster, supply-constrained markets of recent years.
A Compelling Window for Buyers
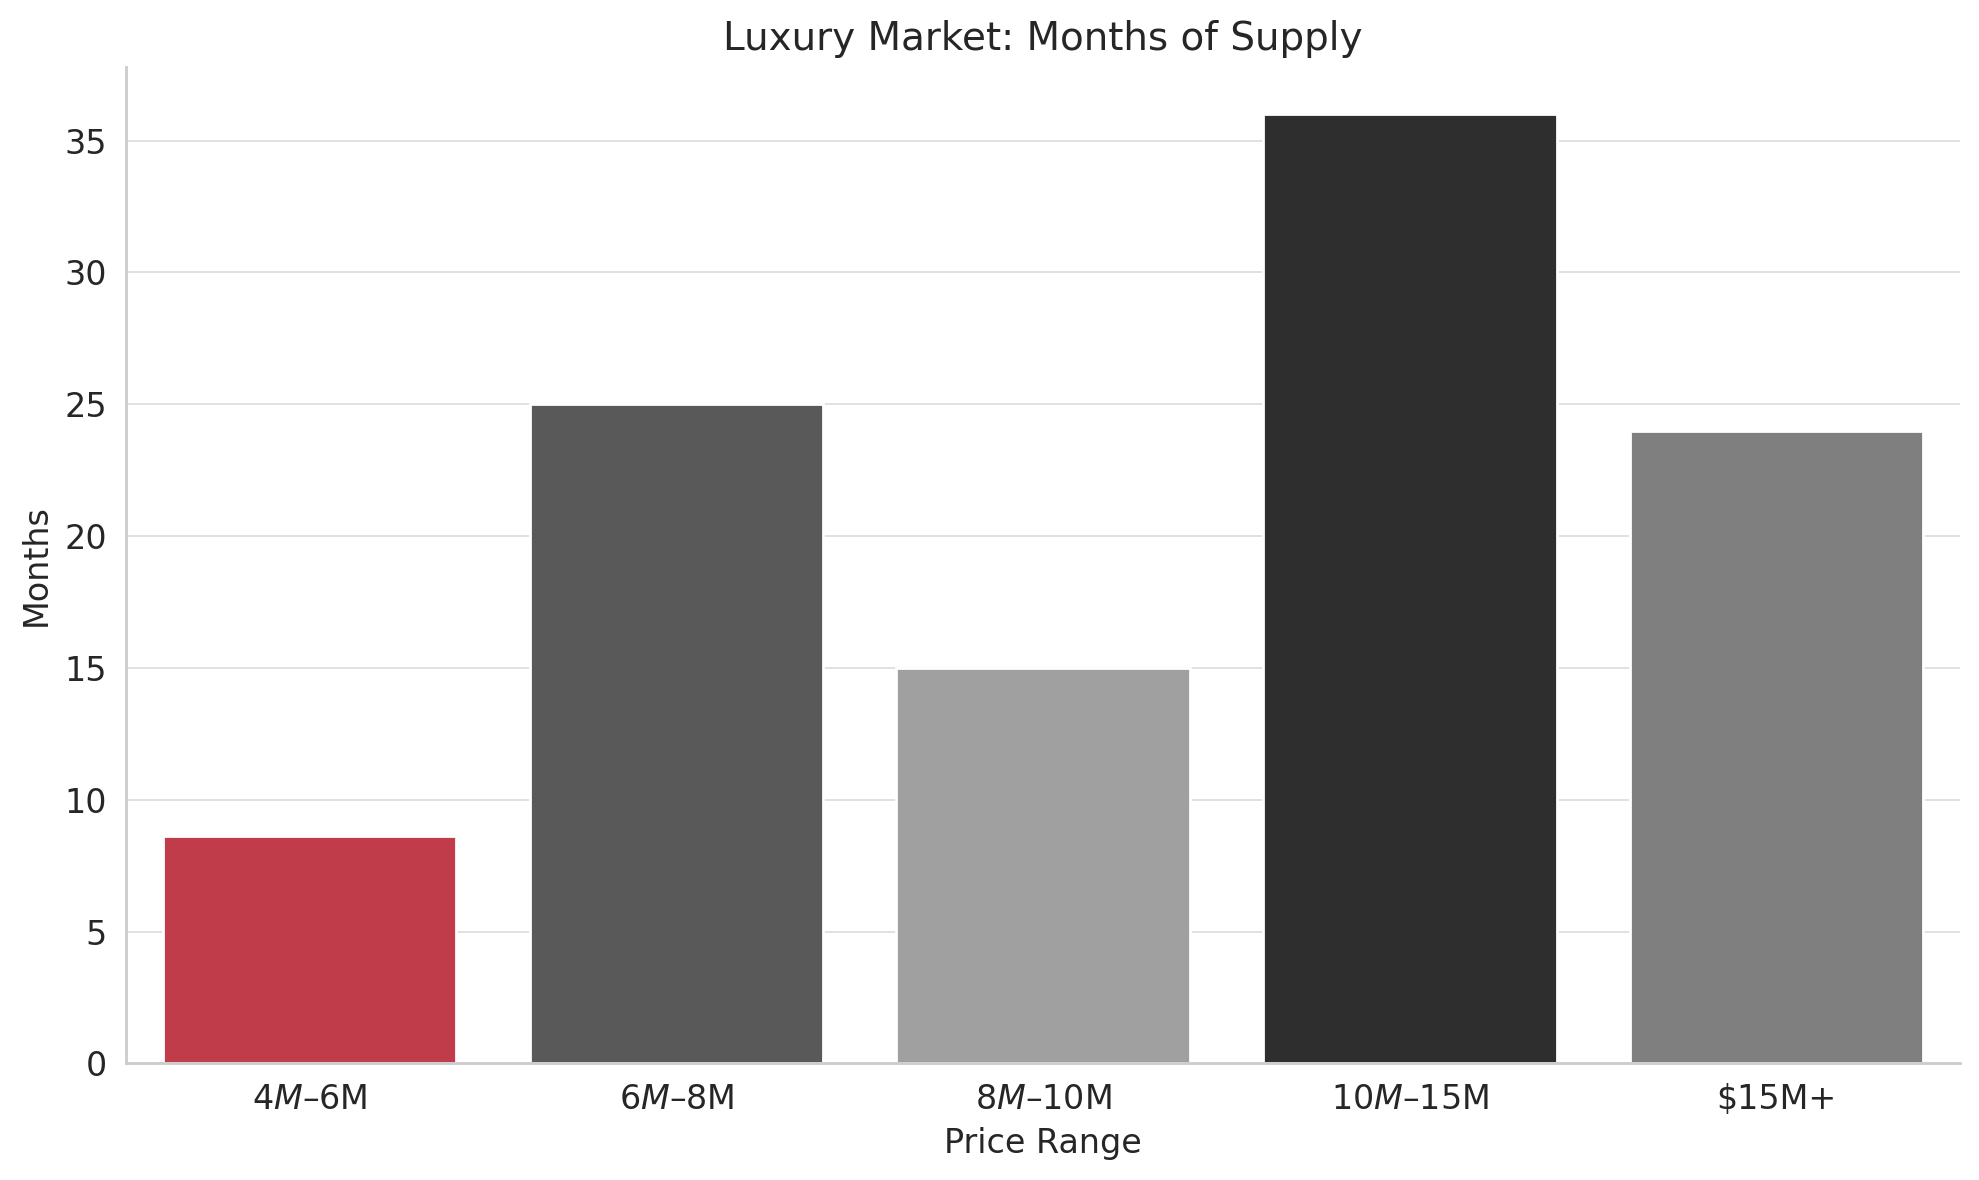
For buyers, current conditions present advantages not seen in several years. Increased inventory across nearly all price points, longer decision timelines, greater negotiating leverage, and expanded opportunities to secure premium properties on favorable terms are defining today’s environment.
For both lifestyle buyers and long-term investors, Summit County continues to offer compelling relative value when compared to other premier resort markets throughout the West.
Market Leadership Backed by Results
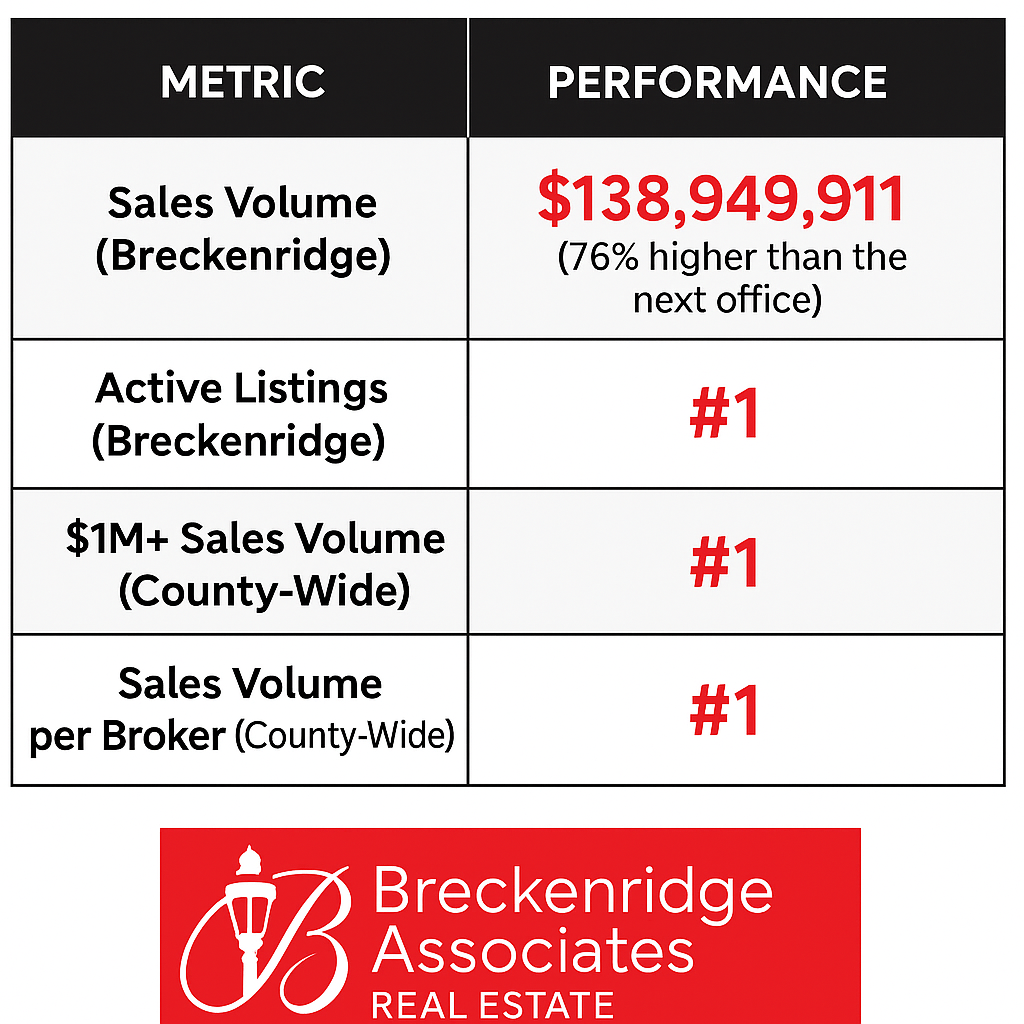
Breckenridge Associates Real Estate continued to lead the Summit County market throughout 2025, delivering consistent performance across every segment. The firm finished the year as the top office countywide in total sales volume, led the $1M+ luxury category, and remained the number one brokerage in Breckenridge by volume. Breckenridge Associates also ranked first in production per broker, reflecting the experience, tenure, and professionalism of its team.
Decades of local market knowledge, a deep understanding of Summit County’s micro-markets, and a client-first approach continue to drive results in both strong and transitional market cycles.
Long-Term Value in a Market Built to Endure
Summit County real estate remains one of the most resilient and rewarding asset classes available, offering a rare combination of financial durability and lifestyle value. As broader equity markets fluctuate, many buyers continue to allocate capital toward tangible mountain assets that provide long-term stability, personal enjoyment, and generational appeal.
This is a highly localized market where expert guidance and strategic positioning make a measurable difference. The brokers at Breckenridge Associates Real Estate are proud to lead the market and grateful for the continued trust our clients place in us with their most meaningful investments.